

One of the most talked about concepts in crypto is the Bitcoin four year cycle. You hear it referenced during bull markets, debated during bear markets, and questioned whenever price behavior does not match expectations. At the center of this discussion is the Bitcoin 4 year cycle chart.
This chart helps visualize how Bitcoin has historically moved through long market phases tied loosely to time, supply changes, and investor behavior. While the cycle is not a perfect blueprint, it remains one of the most useful frameworks for understanding Bitcoin’s long term structure.
What Is the Bitcoin Four Year Cycle
The Bitcoin four year cycle is commonly associated with Bitcoin’s halving events. Approximately every four years, the reward miners receive for validating blocks is cut in half. This reduces the rate at which new Bitcoin enters circulation.
Historically, these supply changes have coincided with long periods of accumulation followed by major price expansions. Over time, this created a pattern where markets rise, peak, decline, and reset over multi year periods.
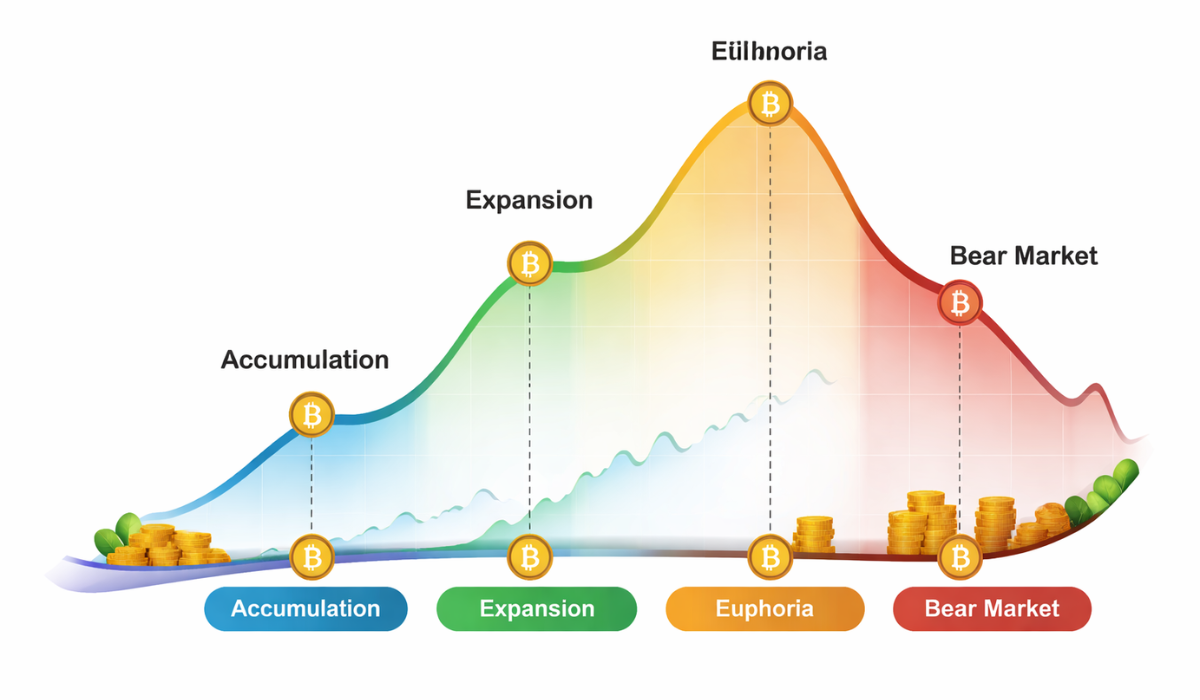
A Bitcoin 4 year cycle chart shows these phases visually, making it easier to see how long each stage lasts and how sentiment shifts throughout the cycle.
How the Four Year Cycle Has Played Out Historically
Looking back at previous Bitcoin cycles, a familiar rhythm appears. After a halving, price often moves slowly at first. This is followed by a stronger expansion phase as momentum builds and awareness grows. Eventually, price reaches a euphoric peak where risk is high and volatility increases.
After the peak, Bitcoin typically enters a prolonged correction and consolidation period. These quieter phases are often where long term positioning happens, even though they receive the least attention.
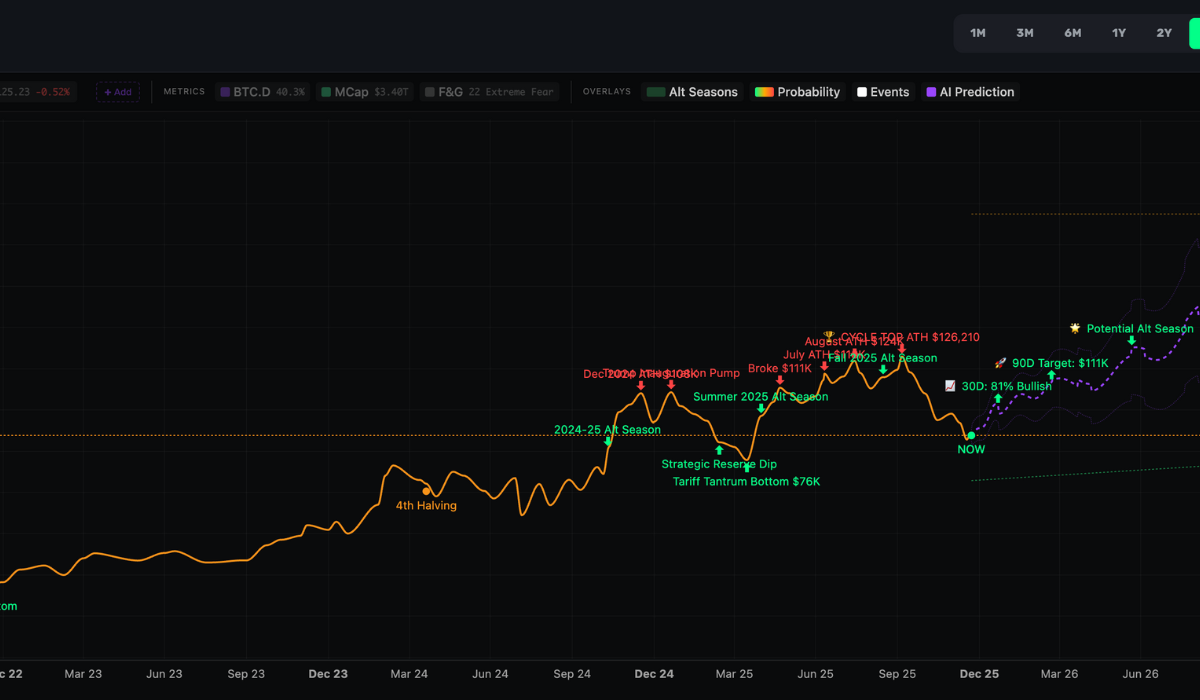
The Bitcoin 4 year cycle chart allows you to compare these periods across multiple cycles without assuming that each one will behave exactly the same.
Why the Four Year Cycle Is Not Exact
One of the biggest misunderstandings is the belief that Bitcoin cycles follow a strict four year schedule. In reality, cycles stretch and compress depending on market conditions, liquidity, and adoption.
As Bitcoin has matured, price movements have become less extreme and more influenced by global economic factors. This does not mean the cycle is broken. It means the market is evolving.
A good Bitcoin 4 year cycle chart helps account for these changes by focusing on structure rather than fixed dates.
How to Use the Bitcoin 4 Year Cycle Chart Properly
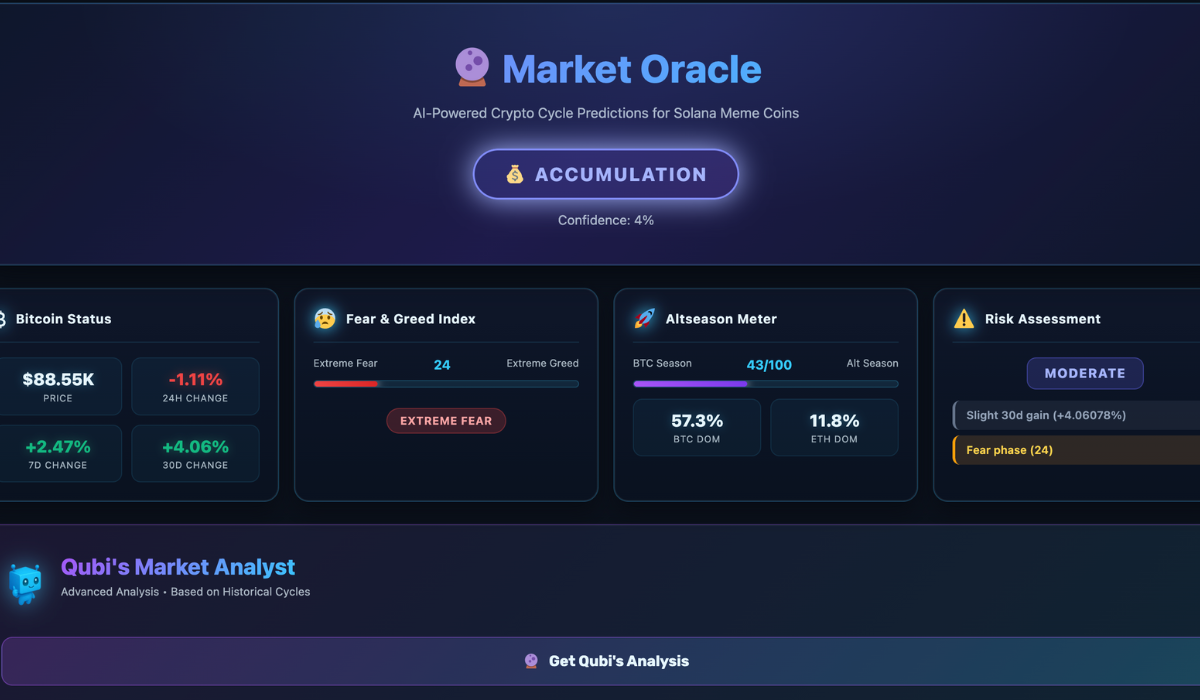
The purpose of a crypto cycle chart is not to predict exact tops or bottoms. It is to provide perspective. When price is extended far beyond historical trends, risk increases. When price spends long periods below long term averages and sentiment is negative, opportunity tends to grow.
Using a Bitcoin 4 year cycle chart correctly means looking at probabilities instead of certainties. It encourages patience, discipline, and long term thinking instead of emotional reactions.
This perspective is especially valuable during periods of volatility when narratives change quickly.
Why Cycle Charts Still Matter Today
Even as Bitcoin becomes more integrated into global markets, human behavior remains the same. Fear, greed, and optimism continue to move markets in waves.
The Bitcoin 4 year cycle chart remains relevant because it reflects these behavioral patterns over time. It helps filter noise and keep decisions grounded in historical context.
If you want to explore this visually, our Bitcoin Cycle Chart tool allows you to view multiple cycles side by side, compare historical phases, and see how current market behavior fits into the broader picture.
Final Thoughts
The Bitcoin four year cycle is not a guarantee, but it is not a myth either. It is a framework built on history, supply dynamics, and psychology.
A Bitcoin 4 year cycle chart does not tell you what will happen next. It helps you understand where you are within the long journey of the market. That understanding alone can dramatically improve how you navigate crypto over time.